

Incident List
Flashduty On-call provides two entry points to view the incident list. One is within a channel, the other is under the Incident Management menu. The difference is that under Incident Management, you can see incidents from multiple channels, even all incidents across the entire account.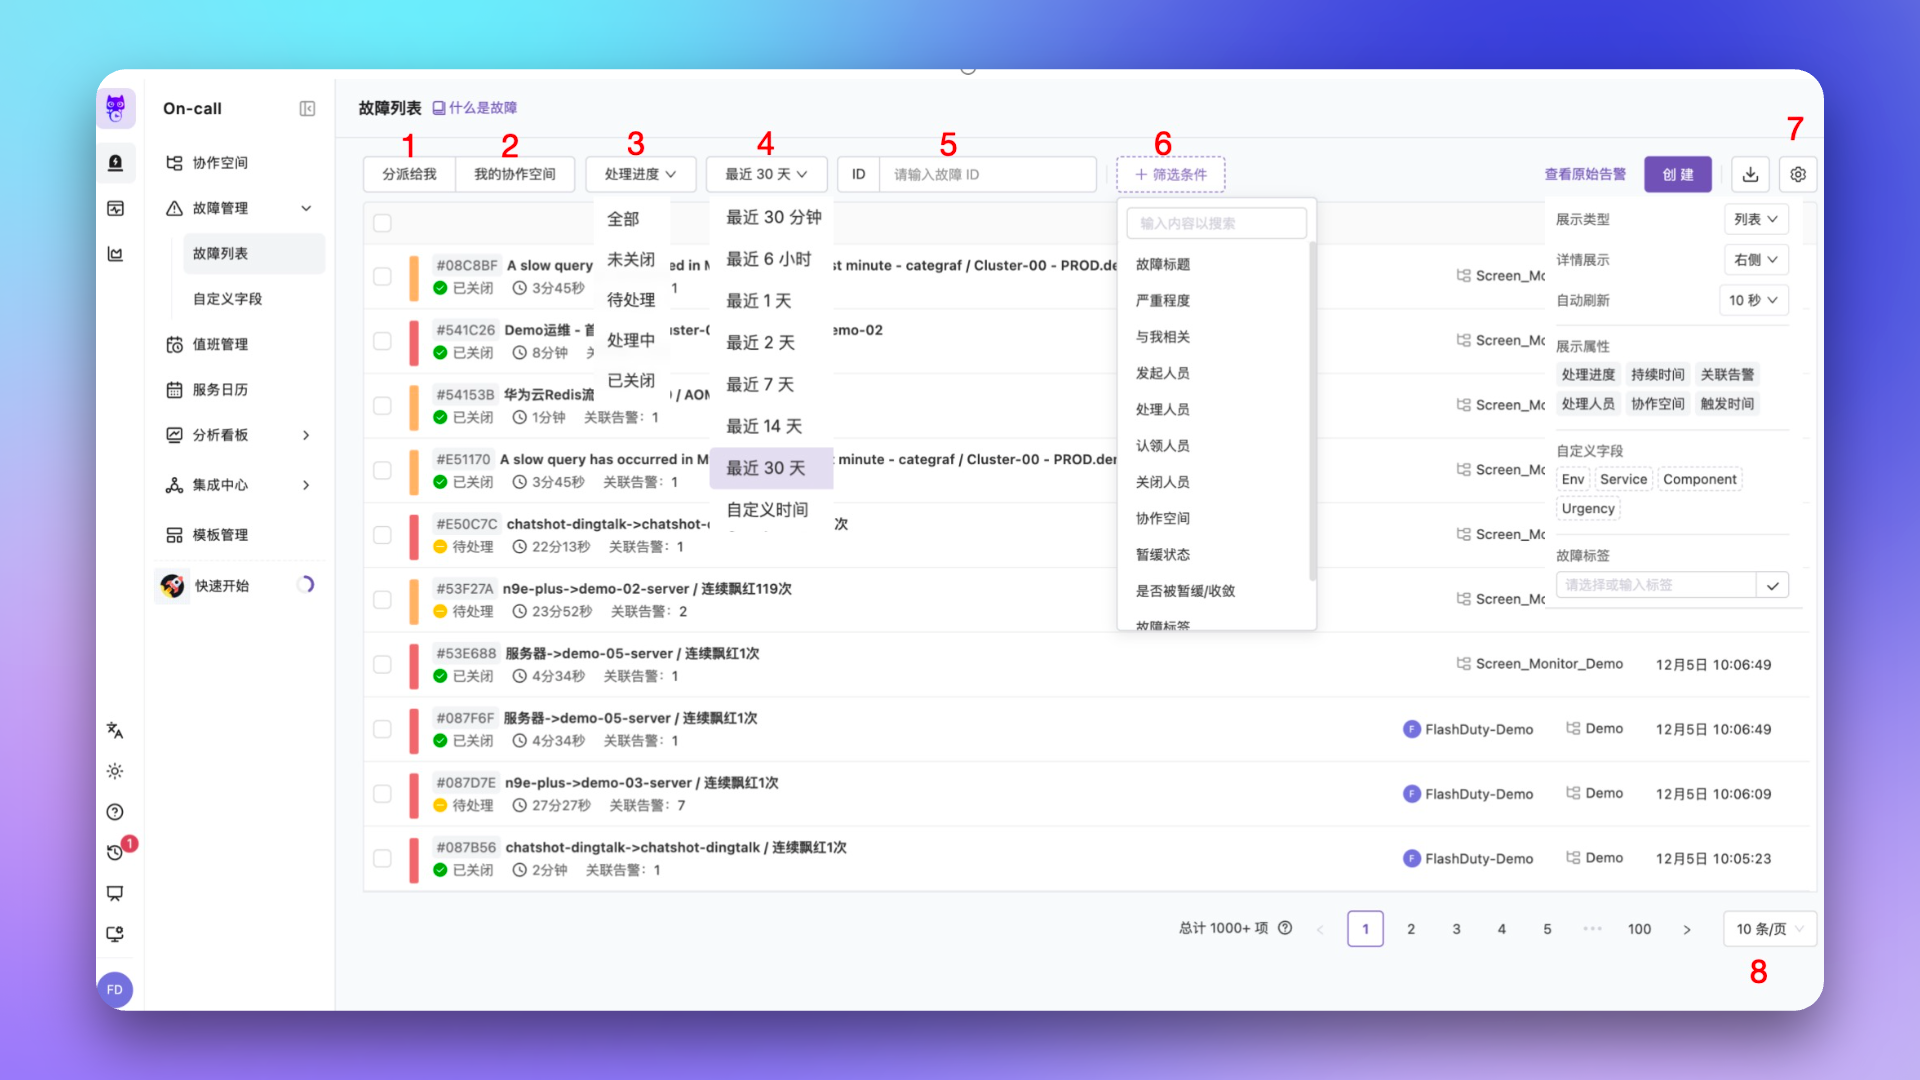
To improve performance, when search conditions match more than 1000 incidents, the system only displays 1000+, not the exact number. Therefore, you can only view 1000 incidents through pagination. To see more, please adjust your search time range or use the Incident Query API to get all data.
Using Aggregate View
Aggregate view provides a different perspective for viewing incidents, where you can define different aggregation dimensions. The essence of aggregation dimensions is real-time Group By, such as viewing grouped by severity.
- Pick an existing rule: Click the dropdown to switch between all saved grouping rules under the current account. Each rule defines a set of Group By attributes (for example, by Severity + Channel +
labels.service) - Create a rule: At the bottom of the dropdown, click New to select attributes, labels, and custom fields in the popup card, name the rule, and save it for future reuse
- Edit or delete a rule: Hover over an existing rule to edit or delete it via the inline icons
- Share a rule in a session: The selected rule’s
view_idis reflected in the list URL parameter, making it easy to share the same perspective with other members
To improve performance, in aggregate view, the system matches at most 100 records for aggregation. Therefore, the list you see may not contain all matching data. If this concerns you, please switch to list view.
Using More Filters
Flashduty On-call provides filtering capabilities across various dimensions with ample flexibility. Typical scenarios include:- Search for incidents triggered by the “Host Down” alert policy based on
checklabel - Search for incidents marked as “false positive” based on the false alarm field
Row content
Beyond the title and progress, each incident row surfaces two key counters:- Associated alerts: total number of alerts grouped into this incident
- Alert events: cumulative count of events merged into the incident. When a new event has been merged in the past 5 minutes, the merge icon turns orange to signal that the incident is still actively aggregating
Custom Rendering
Click the Settings button in the upper right corner of the incident list to customize display content and interaction behavior:Incident Details
Incident details is the main entry point for investigating incidents, displaying all available information. Especially on the incident overview page, Flashduty On-call centrally displays the information you need most.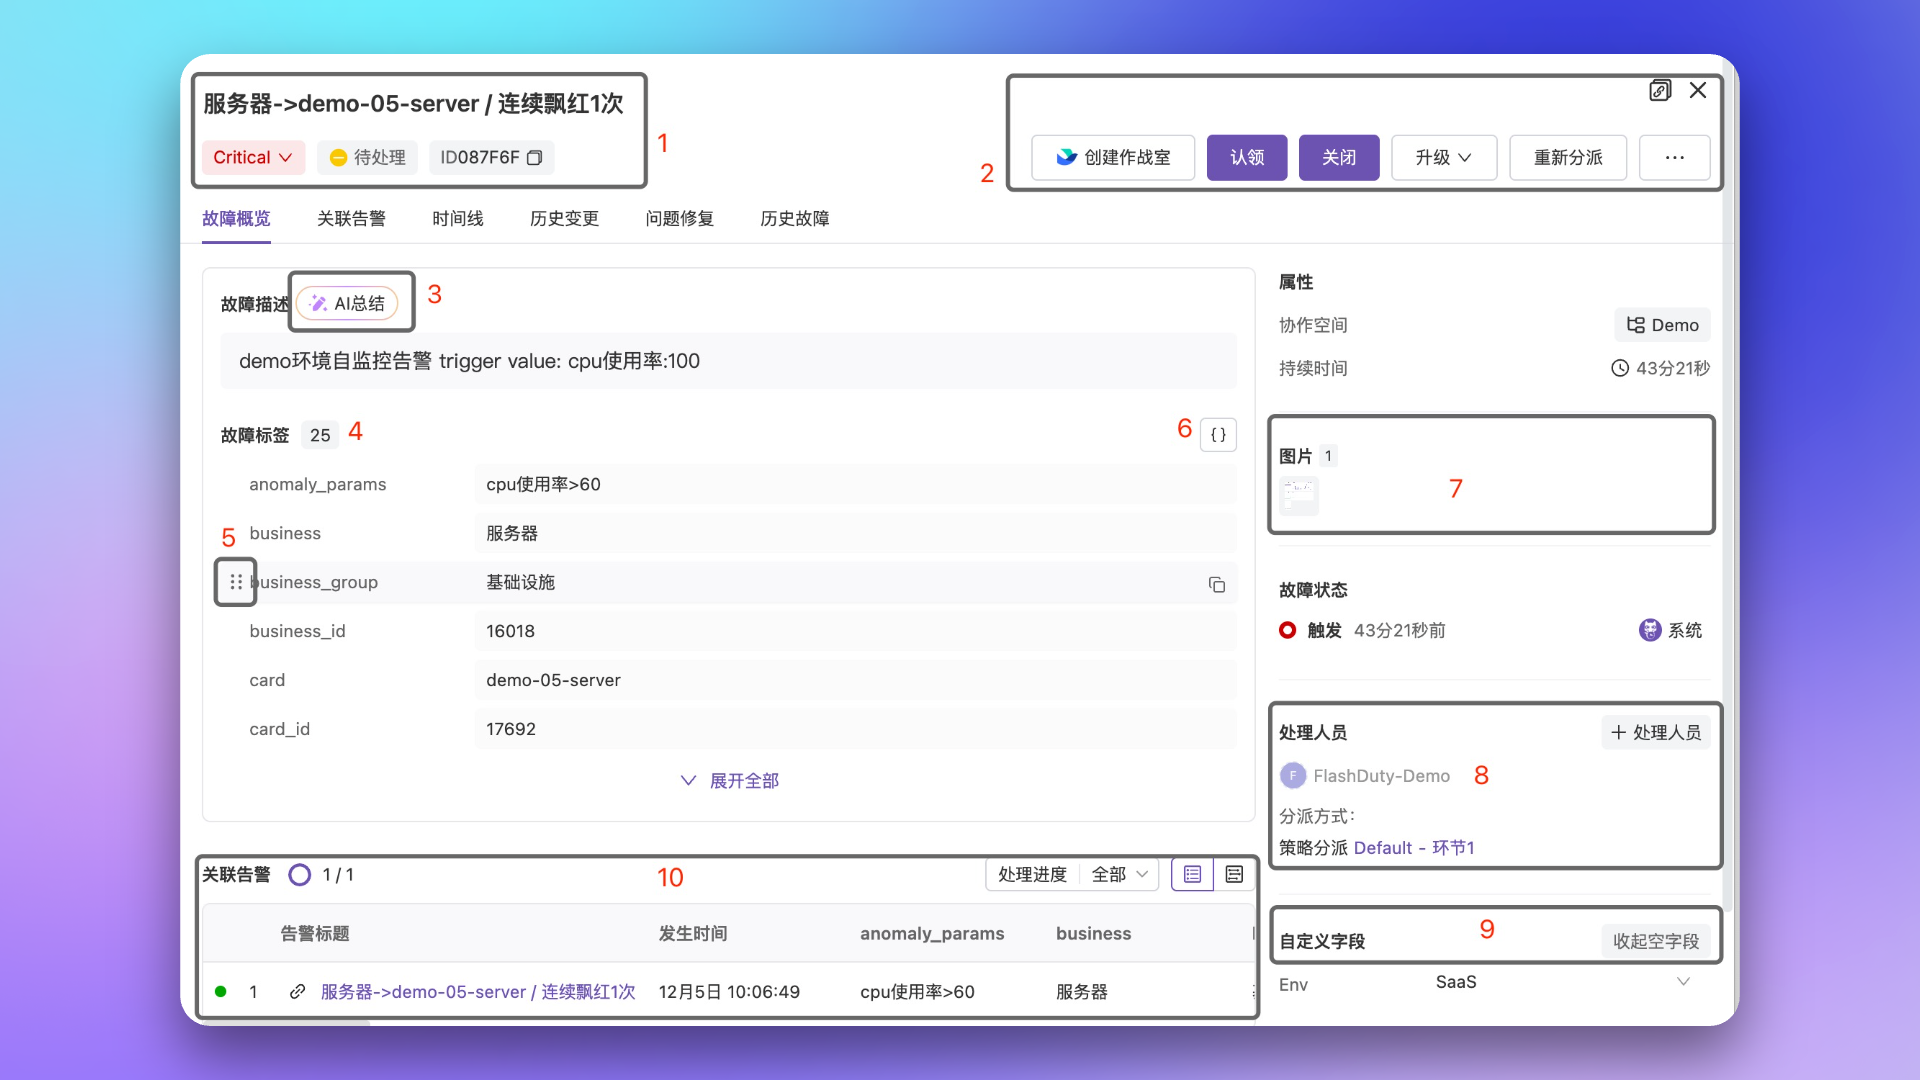
Detail Tabs
The incident details page contains 7 tabs; some appear only under certain conditions:Timeline Comments
The top of the Timeline tab provides a Markdown comment box that supports:- Writing notes, troubleshooting memos, or meeting summaries in Markdown syntax
- Pasting or uploading images directly; screenshots are auto-uploaded and converted into image links
- Appending the published comment as a record on the incident timeline, interleaved with system-generated events for easy retrospection
War Room Operations
If a war room has been created for the incident (requires enabling War Room in IM integration), the More menu on the action bar reveals two additional war-room management actions:War-room management actions are only visible when a war room already exists for the current incident; the create action is still initiated by the Create War Room button on the action bar.
Post-Mortem
The incident details page has a built-in post-mortem editor, allowing you to complete the entire post-mortem workflow without leaving the page. The action area includes a shortcut button that navigates directly to the Post-Mortem tab. In the Post-Mortem tab, you can perform the following actions:
See Post-Mortem for details.
Change History
The Change History tab shows change events correlated with the current incident in time, helping you quickly determine whether the root cause is related to a recent deployment or configuration change. The change event list displays the following information:
You can adjust the query scope through the filter at the top, including time range and change source. Expand any row to view a timeline visualization of that change event, allowing comparison with the incident trigger time.
AI Summary
The incident details page supports one-click AI summary generation to help you quickly understand the full picture of an incident. Click the AI Summary button in the details area, and the system will automatically generate a structured summary based on the incident’s associated alerts (up to 20), including:- Summary: A one-sentence description of what happened
- Impacts: Key affected resources such as services, systems, environments, and instances
- Actions: Immediately actionable investigation and remediation steps (up to 3)
Comprehensive Info Panel
The comprehensive info panel on the right side of the incident details page consolidates auxiliary information around the incident. From top to bottom:FAQ
Console error: Due to the large volume of data, we are unable to respond...
Console error: Due to the large volume of data, we are unable to respond...
This error often appears on incident/alert list queries, analytics dashboards, etc. It’s mainly because the system matched too much data and the query timed out.In this case, please narrow your query scope, such as time range, or use more precise query conditions. If issues persist, please contact us.